Source-based educational review. Independent technical review pending; this page does not approve an installation.
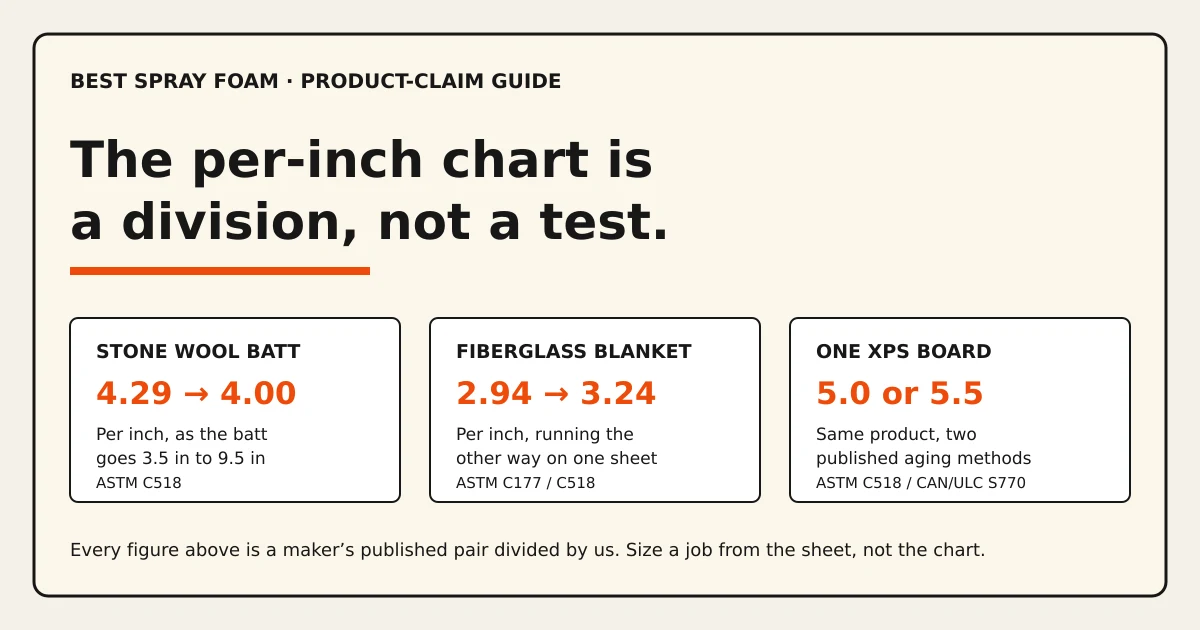
The short version. The per-inch comparison chart is a convenience, not a measurement. No US agency publishes one. The figures come from trade groups and manufacturers, and they are reached by dividing a tested R-value by a thickness. Do that division yourself on three published data sheets and you get three different behaviors: on a stone wool batt the per-inch figure falls as the product gets thicker, on a fiberglass blanket it rises, and on an XPS board one product returns 5.0, 5.4 or 5.5 per inch depending on the test temperature and the aging method. Use the chart to sort materials into rough tiers. Use the product’s own sheet, at the thickness you plan to install, to size anything.
Where the numbers on a comparison chart come from
Search for an insulation R-value chart and you will find the same table on dozens of sites: fiberglass around 3, cellulose around 3.5, mineral wool around 4, closed-cell spray foam around 6 or 7. It is rarely sourced, and the reason is that there is no single authority to source it to.
What exists instead is this. The DOE Insulation Fact Sheet gives two rules of thumb, and gives them for a specific job: working out what is already in your attic. Multiply fiberglass batt thickness by 3.2, multiply foam board or sprayed-on foam by 5. ENERGY STAR publishes recommended total R-values by climate zone, which is the number a project gets sized against. Between those two sits a gap, and the trade associations fill it: the Cellulose Insulation Manufacturers Association for cellulose, the Spray Foam Coalition for professional foam, NAIMA for fiberglass and stone wool, each publishing a figure for its own members’ products.
Those figures are not invented. They are just further from the test than they look, because each one has been through a division.
What a published sheet actually states
Under 16 CFR 460.5, an insulation R-value has to come from one of four named ASTM tests, run on the insulation alone with no airspace, at a mean temperature of 75 F. Nothing in that rule produces a per-inch number. It produces a value for a specimen at a thickness.
Manufacturers publish exactly that, as pairs. Here is what four of them state, and what the division gives.
| Product | Published by the maker | Per inch, by division | Test named |
|---|---|---|---|
| ROCKWOOL Comfortbatt stone wool | R15 at 3.5 in, R23 at 5.5 in, R30 at 7.25 in, R38 at 9.5 in | 4.29, 4.18, 4.14, 4.00 | ASTM C518 |
| Owens Corning EcoTouch fiberglass blanket | R-10 at 3.4 in, R-13 at 4.3 in, R-19 at 6.3 in, R-30 at 9.25 in | 2.94, 3.02, 3.02, 3.24 | ASTM C177 / C518 |
| Owens Corning FOAMULAR 250 XPS board, aged 180 days | R-5.0 at 1 in, R-10 at 2 in, R-20 at 4 in | 5.00, 5.00, 5.00 | ASTM C518 at 75 F mean |
| The same FOAMULAR 250 board, long-term method | R-5.0 at 1 in, R-10.6 at 2 in, R-22.0 at 4 in | 5.00, 5.30, 5.50 | CAN/ULC S770-03 |
Read down the first column and the per-inch figure drops by seven percent across the range. Read down the second and it climbs by ten percent. Read the third and fourth together and one board gives a flat 5.0 under one method and a rising 5.0 to 5.5 under another. The same sheet also states R-5.4 at one inch at a 40 F mean temperature, which is the identical board tested colder.
Owens Corning does not bury this. The sheet says it in a footnote, in its own words: R-values vary depending on many factors including the mean temperature at which the test is conducted, and the age of the sample at the time of testing. It then names which of its several figures is the one printed on the product, the 180 day value at 75 F, because that is the one used to compare products.
That footnote is the whole subject of this page. A comparison chart picks one of those numbers and prints it as the property of the material.
Why the rules restrict the per-inch form
16 CFR 460.20 tells sellers not to give an R-value for one inch or per inch in labels, fact sheets, ads or promotional material. There are two exceptions, and the important one requires actual test results proving the R-value per inch does not drop as the material gets thicker. Even then the seller has to state how much it drops and add a warning sentence.
The Comfortbatt line above is what that rule is written about. Nothing there is wrong or misleading: the maker published four honest pairs. It is the division that introduces the error, and the size of the error depends on which pair you divide.
This site does the division anyway, in the comparison tables, so that eleven canned kits sold in different can sizes can be lined up in one column. Every one of those figures carries the thickness and the document it came from, and none of them is a claim that the foam delivers that value at any depth you like. Where a maker reported at two inches, that is what the record says.
Cellulose does not have a per-inch number you can measure with a tape
Cellulose is the row where the chart breaks most cleanly. CIMA’s guidance says it is reasonable to assume an R-factor of 3.8, and then says the thing the chart cannot carry: R-values for cellulose are based on settled thickness and bag count, not installed thickness.
Loose fill settles. A contractor who blows in enough depth on the day and not enough material by weight leaves an attic that measures the right number of inches and holds less insulation than the label promises. That is why the coverage charts on a cellulose bag give a minimum bag count per thousand square feet alongside the depth, and why both have to be met. Settled thickness is determined under the FTC rule’s methodology; installed thickness is checked under ASTM C1374.
A per-inch figure for cellulose is therefore a description of correctly installed material, not a measurement you can take with a ruler in someone else’s attic.
Where canned DIY kits land
Professional foam has trade-body figures: open-cell starting at 3.6 per inch, closed-cell starting at 5.7 per inch, both from the Spray Foam Coalition, neither with a test method attached. The coalition’s own page tells the reader to ask the seller for the fact sheet on R-values, which is the correct advice and the reason this site exists.
Canned kits are a narrower market and the pattern there is sharper. Of the eleven kits in our yield table, seven print exactly 5.66 per inch. Not a range, not a similar figure: the identical number, across brands with different can sizes, different sellers and different countries of origin. Four of those seven can point at a data sheet, a coverage chart or an application guide that prints it. Three cannot, and on those the number lives in store copy or a marketplace table with nothing behind it. The remaining four kits cluster between 4.0 and 4.12, and three of those four got there by halving a two-inch figure.
So 5.66 is not a finding about any one of those foams. It is the number the category prints. Treat it the way you would treat a price that is identical at seven shops: as evidence about the supply chain, not about the product.
The number your project is actually sized against
Material R-value is measured on the insulation alone, excluding any airspace. A wall is not that. The DOE fact sheet is blunt about the gap: heat flows through the framing as well as the cavity, so the overall R-value of a wall or ceiling is somewhat different from the R-value of the insulation itself, and in metal-framed walls the assembly can fall to as low as half the insulation value.
For a homeowner that reorders the questions. Recommended total R-values by climate zone come first, from ENERGY STAR. Then the cavity depth you have. Then which material reaches that total in that depth, which is where the per-inch tiers are genuinely useful: if a 2x4 cavity has to hit a high number, a material at 3 per inch cannot get there and one at 6 can. Then, and only then, the product’s own sheet at the thickness you will install.
How to use a comparison chart without being misled by it
- Use it for tiers, not for arithmetic. Fibrous materials around 3 to 4.3 per inch, rigid boards and closed-cell foams around 5 to 6, is a fair summary of the sheets above.
- Before sizing anything, find the pair. A tested R-value and the thickness it was tested at, on a document with a date on it.
- Check the mean temperature if the figure is for a rigid or closed-cell foam. The FTC test is at 75 F. A colder test gives a better number for the same board.
- Check the aging basis on any closed-cell product. Aged and long-term figures are both legitimate and they are not the same figure.
- For loose fill, check the bag count as well as the depth.
- Add layers if you like. Do not treat the sum as the wall.
Questions buyers ask
What is the R-value per inch of spray foam compared to fiberglass?
The industry body for professional foam gives open-cell as starting at 3.6 per inch and closed-cell as starting at 5.7 per inch, with no test method named. Published fiberglass sheets work out between about 2.9 and 3.2 per inch on one Owens Corning blanket, depending on which thickness in the range you divide. So closed-cell foam is roughly twice fiberglass per inch of depth. That comparison holds only per inch of depth, and a wall is not sold by the inch: the assembly figure depends on framing, cavity depth and air sealing as much as on the material.
Why does the same material show different R-values per inch on different charts?
Because the number is produced by dividing, and the thing being divided changes. A ROCKWOOL Comfortbatt works out at 4.29 per inch at 3.5 in and 4.00 per inch at 9.5 in, from one data sheet. An Owens Corning fiberglass blanket runs the other way, 2.94 per inch at 3.4 in and 3.24 at 9.25 in. Owens Corning FOAMULAR 250 gives 5.0 per inch at a 75 F mean temperature and 5.4 at 40 F, for the same board. Whichever pair a chart divided is the number you see.
Is there an official government R-value chart by material?
Not one that lists a per-inch figure for every material. The DOE Insulation Fact Sheet gives estimating rules of thumb for insulation already in your attic, multiply fiberglass batt thickness by 3.2 and foam by 5, and it is explicit that these are for identifying what you have. ENERGY STAR publishes recommended total R-values by climate zone, which is the number your project is sized against. The per-inch tables circulating online are assembled from trade association and manufacturer figures.
Does closed-cell spray foam lose R-value over time?
Closed-cell foams are gas-filled and their thermal resistance changes as that gas exchanges with air, which is why 16 CFR 460.5 requires polyurethane, polyisocyanurate and extruded polystyrene to be tested on samples that fully reflect the effect of aging, and why ASTM C1303 exists to predict long-term resistance. Owens Corning publishes both an aged and a long-term figure for the same XPS board and says in the sheet which one is printed on the product. A canned kit that states an R-value with no aging basis has not shown you that part.
How many inches of spray foam do I need for R-49?
Take the figure from the product's own sheet at the thickness you plan to install, not a per-inch number multiplied up. If a sheet reports its value at 2 inches, two passes of that thickness is a supported claim and four times the one-inch figure is not. Then check the assembly rather than the material: the DOE fact sheet notes that thermal bridging makes a wall or ceiling perform differently from the insulation in it, and that a metal-framed wall can land as low as half.
Do canned DIY spray foam kits publish a real R-value?
They publish a figure. Seven of the eleven kits in our yield table print exactly 5.66 per inch, which is the same number repeated across brands rather than a separate measurement. Four of those seven can point at a data sheet, coverage chart or application guide that prints it. Three cannot: the figure appears only in store copy or a marketplace table. The remaining four kits cluster between 4.0 and 4.12.
Can I add the R-values of two layers together?
For the materials themselves, yes, and the DOE fact sheet says so directly: in a multi-layered installation the R-values of the individual layers are added. What you cannot do is treat that sum as the performance of the wall. Framing, gaps, compression and air movement all sit outside the material figure, which is measured on the insulation alone with no airspace under 16 CFR 460.5.
Sources and scope
Accessed September 14, 2026. Manufacturer pages describe their own products; a source link is not our certification of its claims.
- ROCKWOOL Comfortbatt technical data sheet, US, issued 05-2025 · Stone wool batt. Thermal resistance under ASTM C518: R15 at 3.5 in, R23 at 5.5 in, R30 at 7.25 in, R38 at 9.5 in. Density above 1.8 lb/ft3 under ASTM C167.
- Owens Corning EcoTouch Insulation with PureFiber Technology for Certified R Metal Building, product data sheet · Fiberglass blanket. Thermal resistance under ASTM C177/C518, labeled to NAIMA 202-96 (Rev. 2000): R-10 at 3.4 in, R-13 at 4.3 in, R-19 at 6.3 in, R-30 at 9.25 in. States the values are for the insulation only and exclude facings, air films and framing.
- Owens Corning FOAMULAR 250 extruded polystyrene, product data sheet · XPS board to ASTM C578 Type IV. R-value at 180 day real-time age under ASTM C518: 5.0 at 1 in and 20 at 4 in at a 75 F mean temperature, 5.4 at 1 in at 40 F. Long-term thermal resistance under CAN/ULC S770-03: 5.0 at 1 in and 22.0 at 4 in. The sheet states that R-values vary with test mean temperature and sample age.
- Cellulose Insulation Manufacturers Association, how to calculate R-value of settled cellulose attic insulation · Trade association guidance. States it is reasonable to assume an R-factor of 3.8, that R-values are based on settled thickness and bag count rather than installed thickness, that settled thickness is determined under the FTC R-Value Rule methodology, and that installed thickness follows ASTM C1374.
- Spray Foam Coalition, R-values and performance · Industry body figures for professionally installed foam: open-cell starting at 3.6 per inch, closed-cell starting at 5.7 per inch. No test method, thickness or aging basis is given on the page, which tells readers to ask the seller for the fact sheet.
- DOE Insulation Fact Sheet, DOE/CE-0180, 2008 (Oak Ridge National Laboratory) · Federal guidance. Gives estimating rules of thumb for insulation already in place: multiply fiberglass batt thickness in inches by 3.2, and foam board or sprayed-on foam thickness by 5. States that the overall R-value of a wall or ceiling differs from the R-value of the insulation itself because of thermal bridging, and that in metal-framed walls the assembly can be as low as half the insulation value.
- 16 CFR 460.5, R-value tests (Cornell Legal Information Institute) · Names ASTM C177-13, C518-17, C1363-11 and C1114-06; tests at a 75 F mean temperature with a 50 F difference plus or minus 10 F; insulation alone, excluding any airspace; polyurethane, polyisocyanurate and extruded polystyrene samples must fully reflect the effect of aging.
- 16 CFR 460.20, R-value per inch claims (Cornell Legal Information Institute) · In labels, fact sheets, ads or other promotional materials, sellers must not give the R-value for one inch or the R-value per inch, with two stated exceptions, one of which requires test results proving the per-inch value does not drop as the material gets thicker.
- ASTM C1303/C1303M-22, predicting long-term thermal resistance of closed-cell foam insulation · Public scope: predicts long-term thermal resistance of unfaced or permeably faced rigid closed-cell foam by thin-slicing to accelerate aging.
- ENERGY STAR recommended home insulation R-values · Recommended total R-values by climate zone and building assembly, which is the figure a project is actually sized against.